
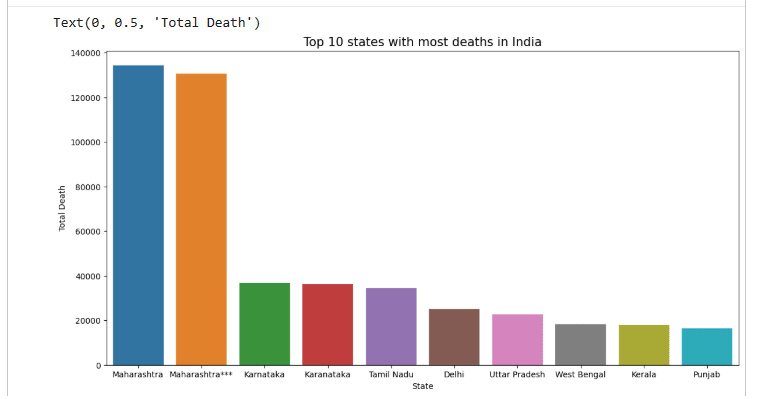
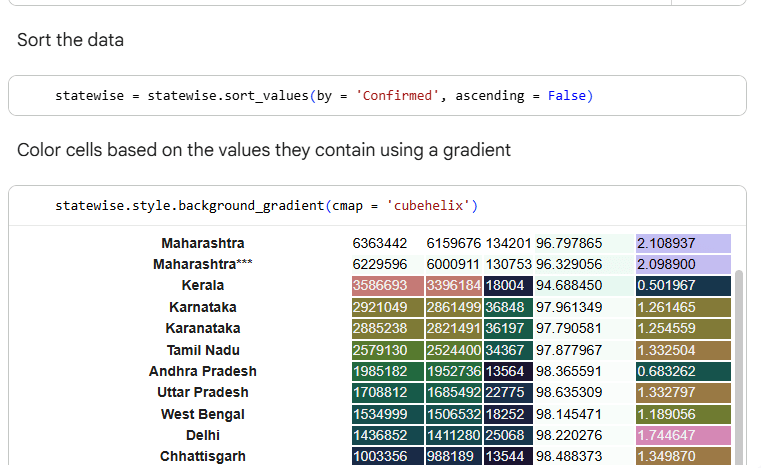
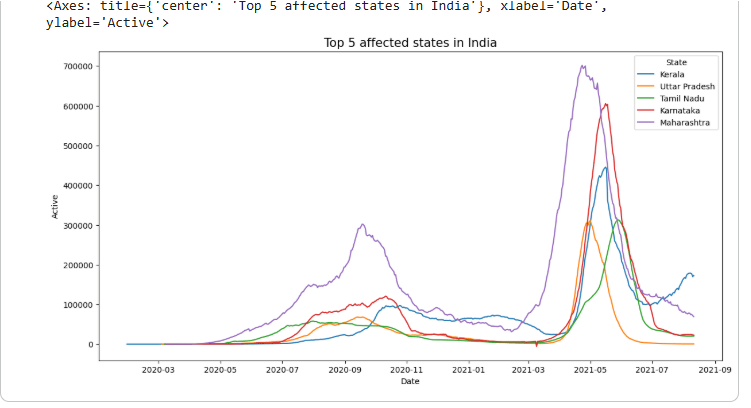
In this project, we performed an in-depth COVID-19 data analysis for India using Python and Jupyter Notebook to examine case trends, mortality, recoveries, and vaccination progress. Leveraging Pandas, NumPy, Matplotlib, Seaborn, and Plotly, We cleaned and merged case and vaccination datasets, generated descriptive statistics, and built insightful visualizations to identify top affected states, active case trends, and vaccination distribution by state, gender, and age group. This project demonstrates my ability to handle real-world public health data, conduct end-to-end data analysis, and present complex insights through clear and meaningful visualizations for data-driven decision-making.