
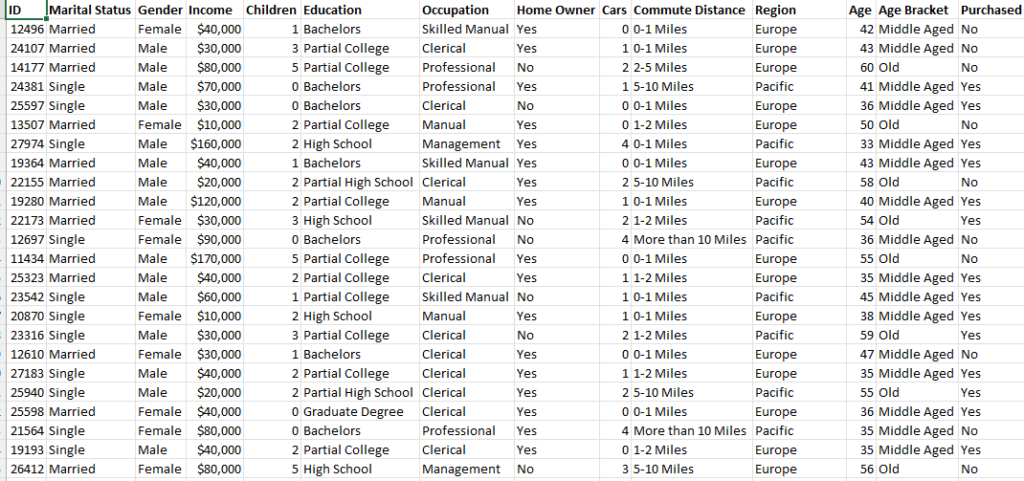
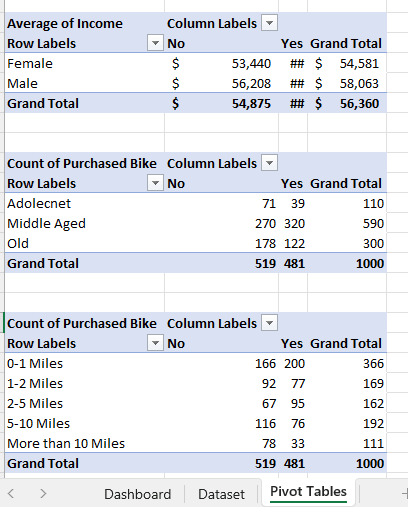
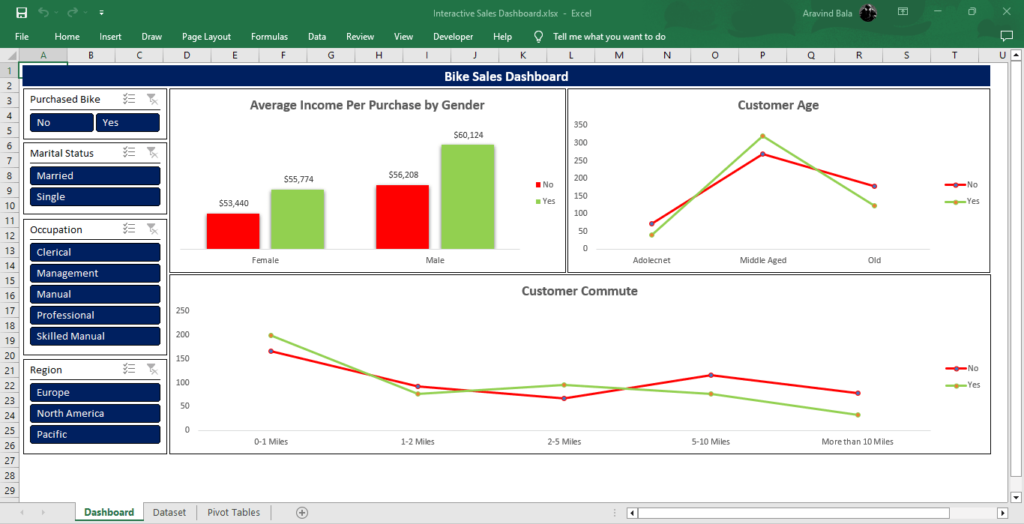
In this project, we analyzed bike sales data across multiple regions and customer segments to develop an interactive Excel dashboard that reveals key purchasing trends. Using Microsoft Excel, we cleaned the data by removing duplicates, created custom columns for deeper analysis, and built dynamic PivotTables, charts, and graphs to visualize sales patterns by age group, gender, income, and commute distance. The insights showed that middle-aged customers purchased the most bikes, males with higher average income bought more bikes than females, and around 20% of buyers had short daily commutes (0–1 mile). This project demonstrates my expertise in data cleaning, transformation, Excel dashboard design, and interactive data visualization for business insights.