
The client, a financial services institution, required an advanced and interactive loan data analytics solution to overcome the limitations of traditional static reporting. Their existing reporting methods lacked interactivity and failed to provide deep insights into lending operations, borrower behavior, and overall loan performance making data driven decision making challenging.

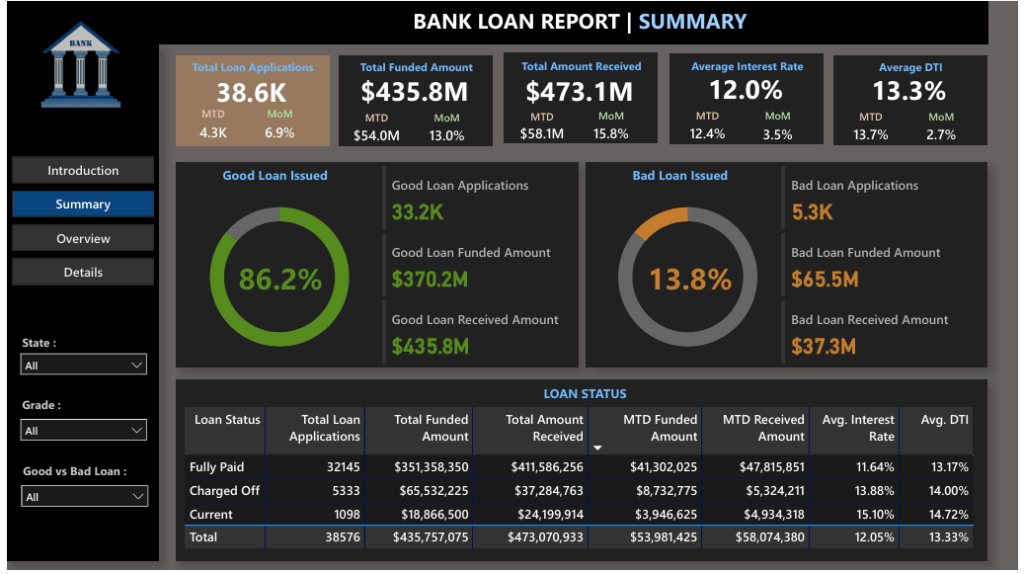
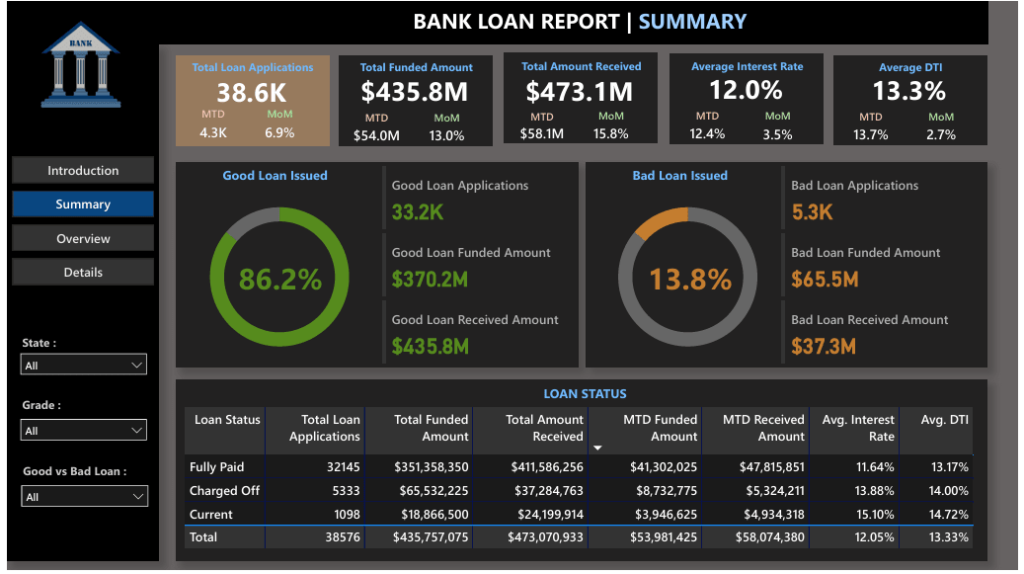
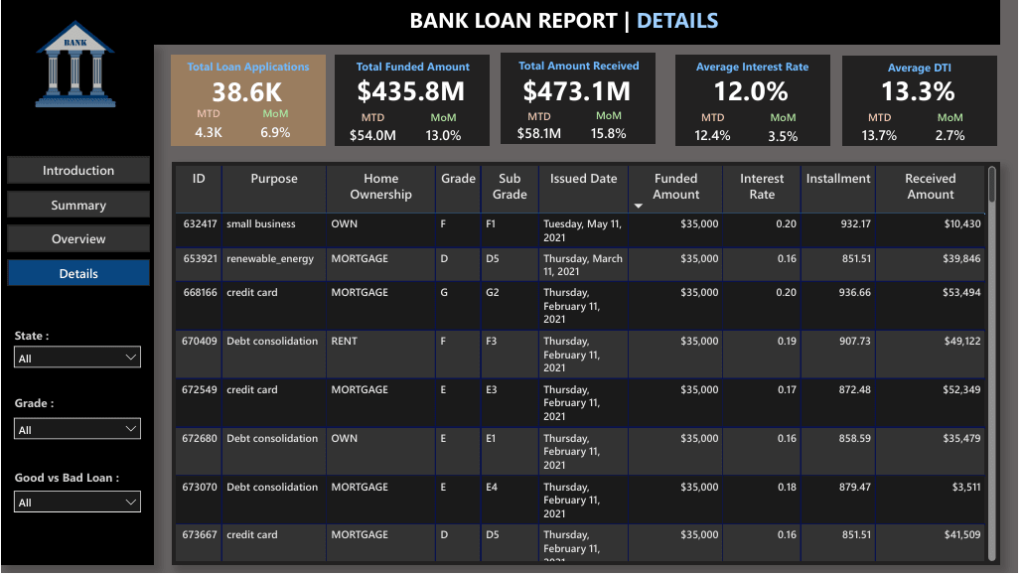
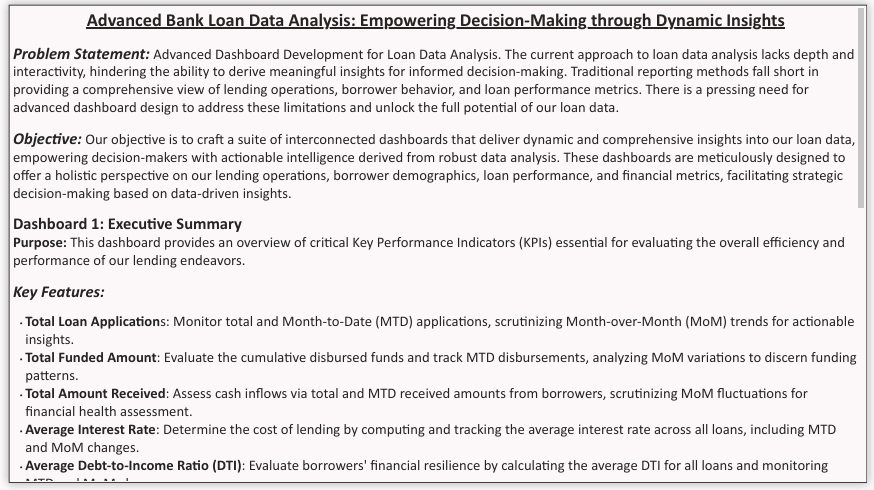
To address this, I designed and developed a suite of interconnected dashboards focused on delivering dynamic, actionable insights from complex loan datasets. The solution centered around an Executive Summary Dashboard that presented critical KPIs such as total loan applications, funded amounts, received payments, average interest rates, and debt-to-income (DTI) ratios. Each KPI included Month-to-Date (MTD) and Month-over-Month (MoM) trend analysis to support strategic decision-making.

Key challenges included managing large datasets, ensuring data accuracy, and creating dashboards that were both insightful and user-friendly for executives. I resolved these by implementing robust data modeling, optimized calculations, and intuitive visual design principles. The final dashboards provided a holistic view of lending performance, improved transparency, and empowered stakeholders with real-time, data driven insights for better financial and operational decisions.