
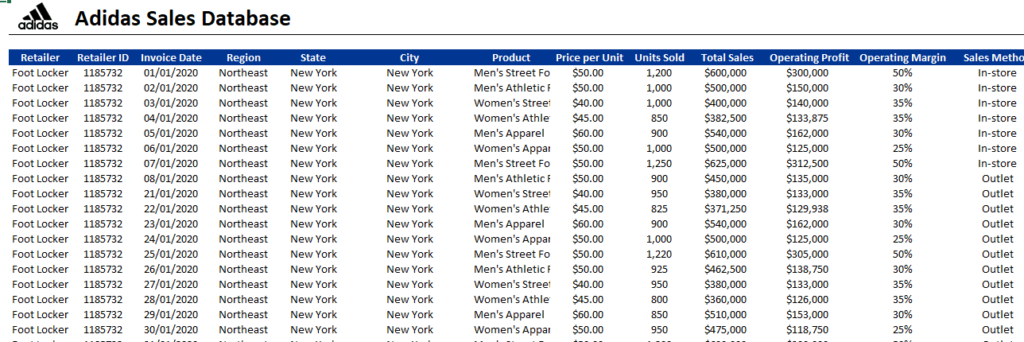
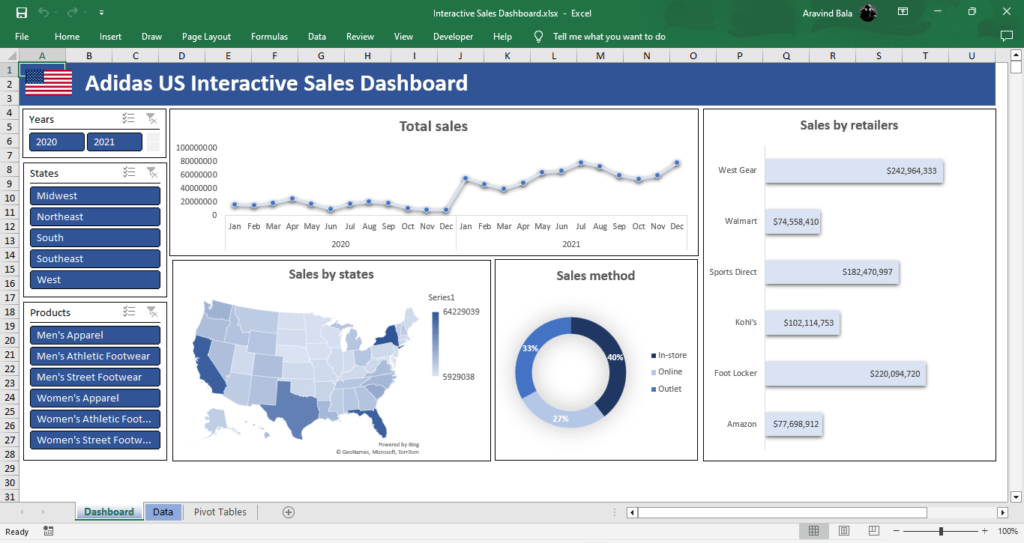
In this project, We analyzed Adidas US sales data and built a fully interactive Excel dashboard to transform raw data into clear, actionable insights. Using Microsoft Excel, pivot tables, pivot charts, and slicers, we cleaned and structured the dataset, analyzed sales performance by channel and state, and designed a single, well-organized dashboard for easy exploration. The analysis revealed that in-store sales dominate overall performance, while New York is the top-performing state in the US. This project highlights my skills in data cleaning, Excel dashboard development, pivot table analysis, and interactive data visualization for real-world business decision-making.