
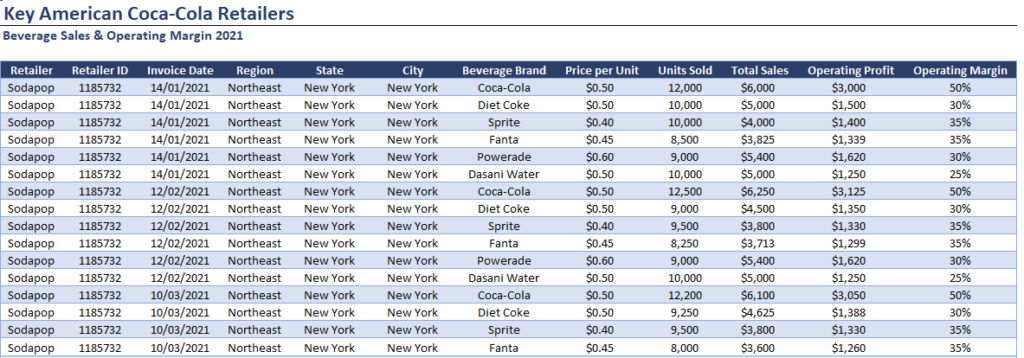
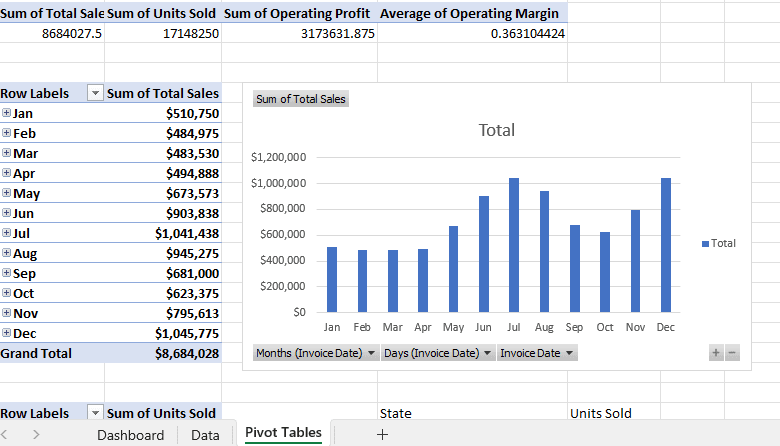
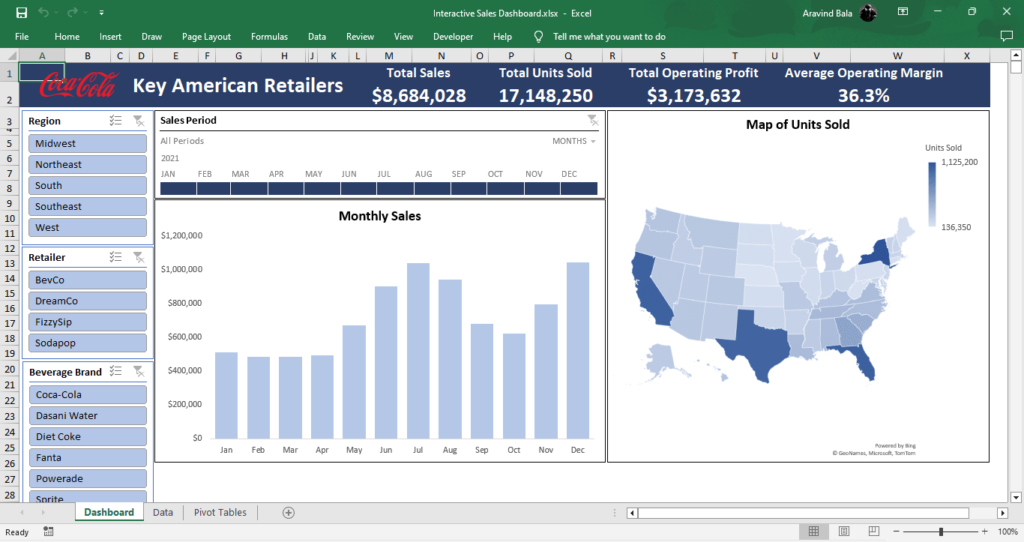
In this project, we created a fully interactive Excel sales dashboard using the Coca-Cola sales dataset to deliver clear financial and regional insights. We structured the data into tables, built pivot tables to summarize key metrics using sums and averages, and developed monthly product analysis with pivot charts and an adjustable timeline. Regional performance was visualized using US map charts, and the entire dashboard was made dynamic with connected slicers for seamless filtering. Key findings show that New York leads unit sales (1,125,200 units), December records the highest sales ($1,045,775), and Sodapop is the top retailer with over $4M in total sales, demonstrating my expertise in Excel dashboard development, pivot table analysis, and interactive data visualization.